
YouTube Metrics That Actually Matter for Channel Growth
The YouTube metrics that actually drive channel growth are watch time, average view duration, audience retention, click-through rate (CTR), traffic sources, and views per viewer. These signals tell the YouTube algorithm whether your content engages viewers and deserves wider distribution.
Vanity metrics like total subscriber count and lifetime view count provide social proof but don't reliably predict growth. Focus on three to five core metrics, review them weekly, and act on the patterns you spot consistently.
YouTube channel growth across different creator brands and niches has consistently shown the same conclusion: only a handful of YouTube metrics drive the algorithm, and the rest are mostly vanity.
Let’s break down which YouTube metrics creators and brands should track, and how to focus on the right ones to boost your brand content and effectiveness.
Quick Verdict
Here are the key YouTube metrics that matter when it comes to sustainable channel growth:
Watch time and average view duration: how long unique viewers stay on your content without clicking away.
Audience retention: where viewers drop off your content or rewatch particular parts.
Click-through rate (CTR): how often users click on your video’s title or thumbnail to “click through” to your video content.
Traffic sources: how different users are finding your content online
New vs. returning viewers and views per viewer: Whether you’re building loyalty through viewers who watch your content
These are the YouTube metrics that can give you insights into how your content is performing, but don’t play as big a role in your video or channel’s success:
Total subscriber count: this is useful as social proof (so others see your video as “popular”), but weak as a video or channel health indicator
Lifetime view count: often inflated by viral spikes, and not always reliable as a long-term growth signal
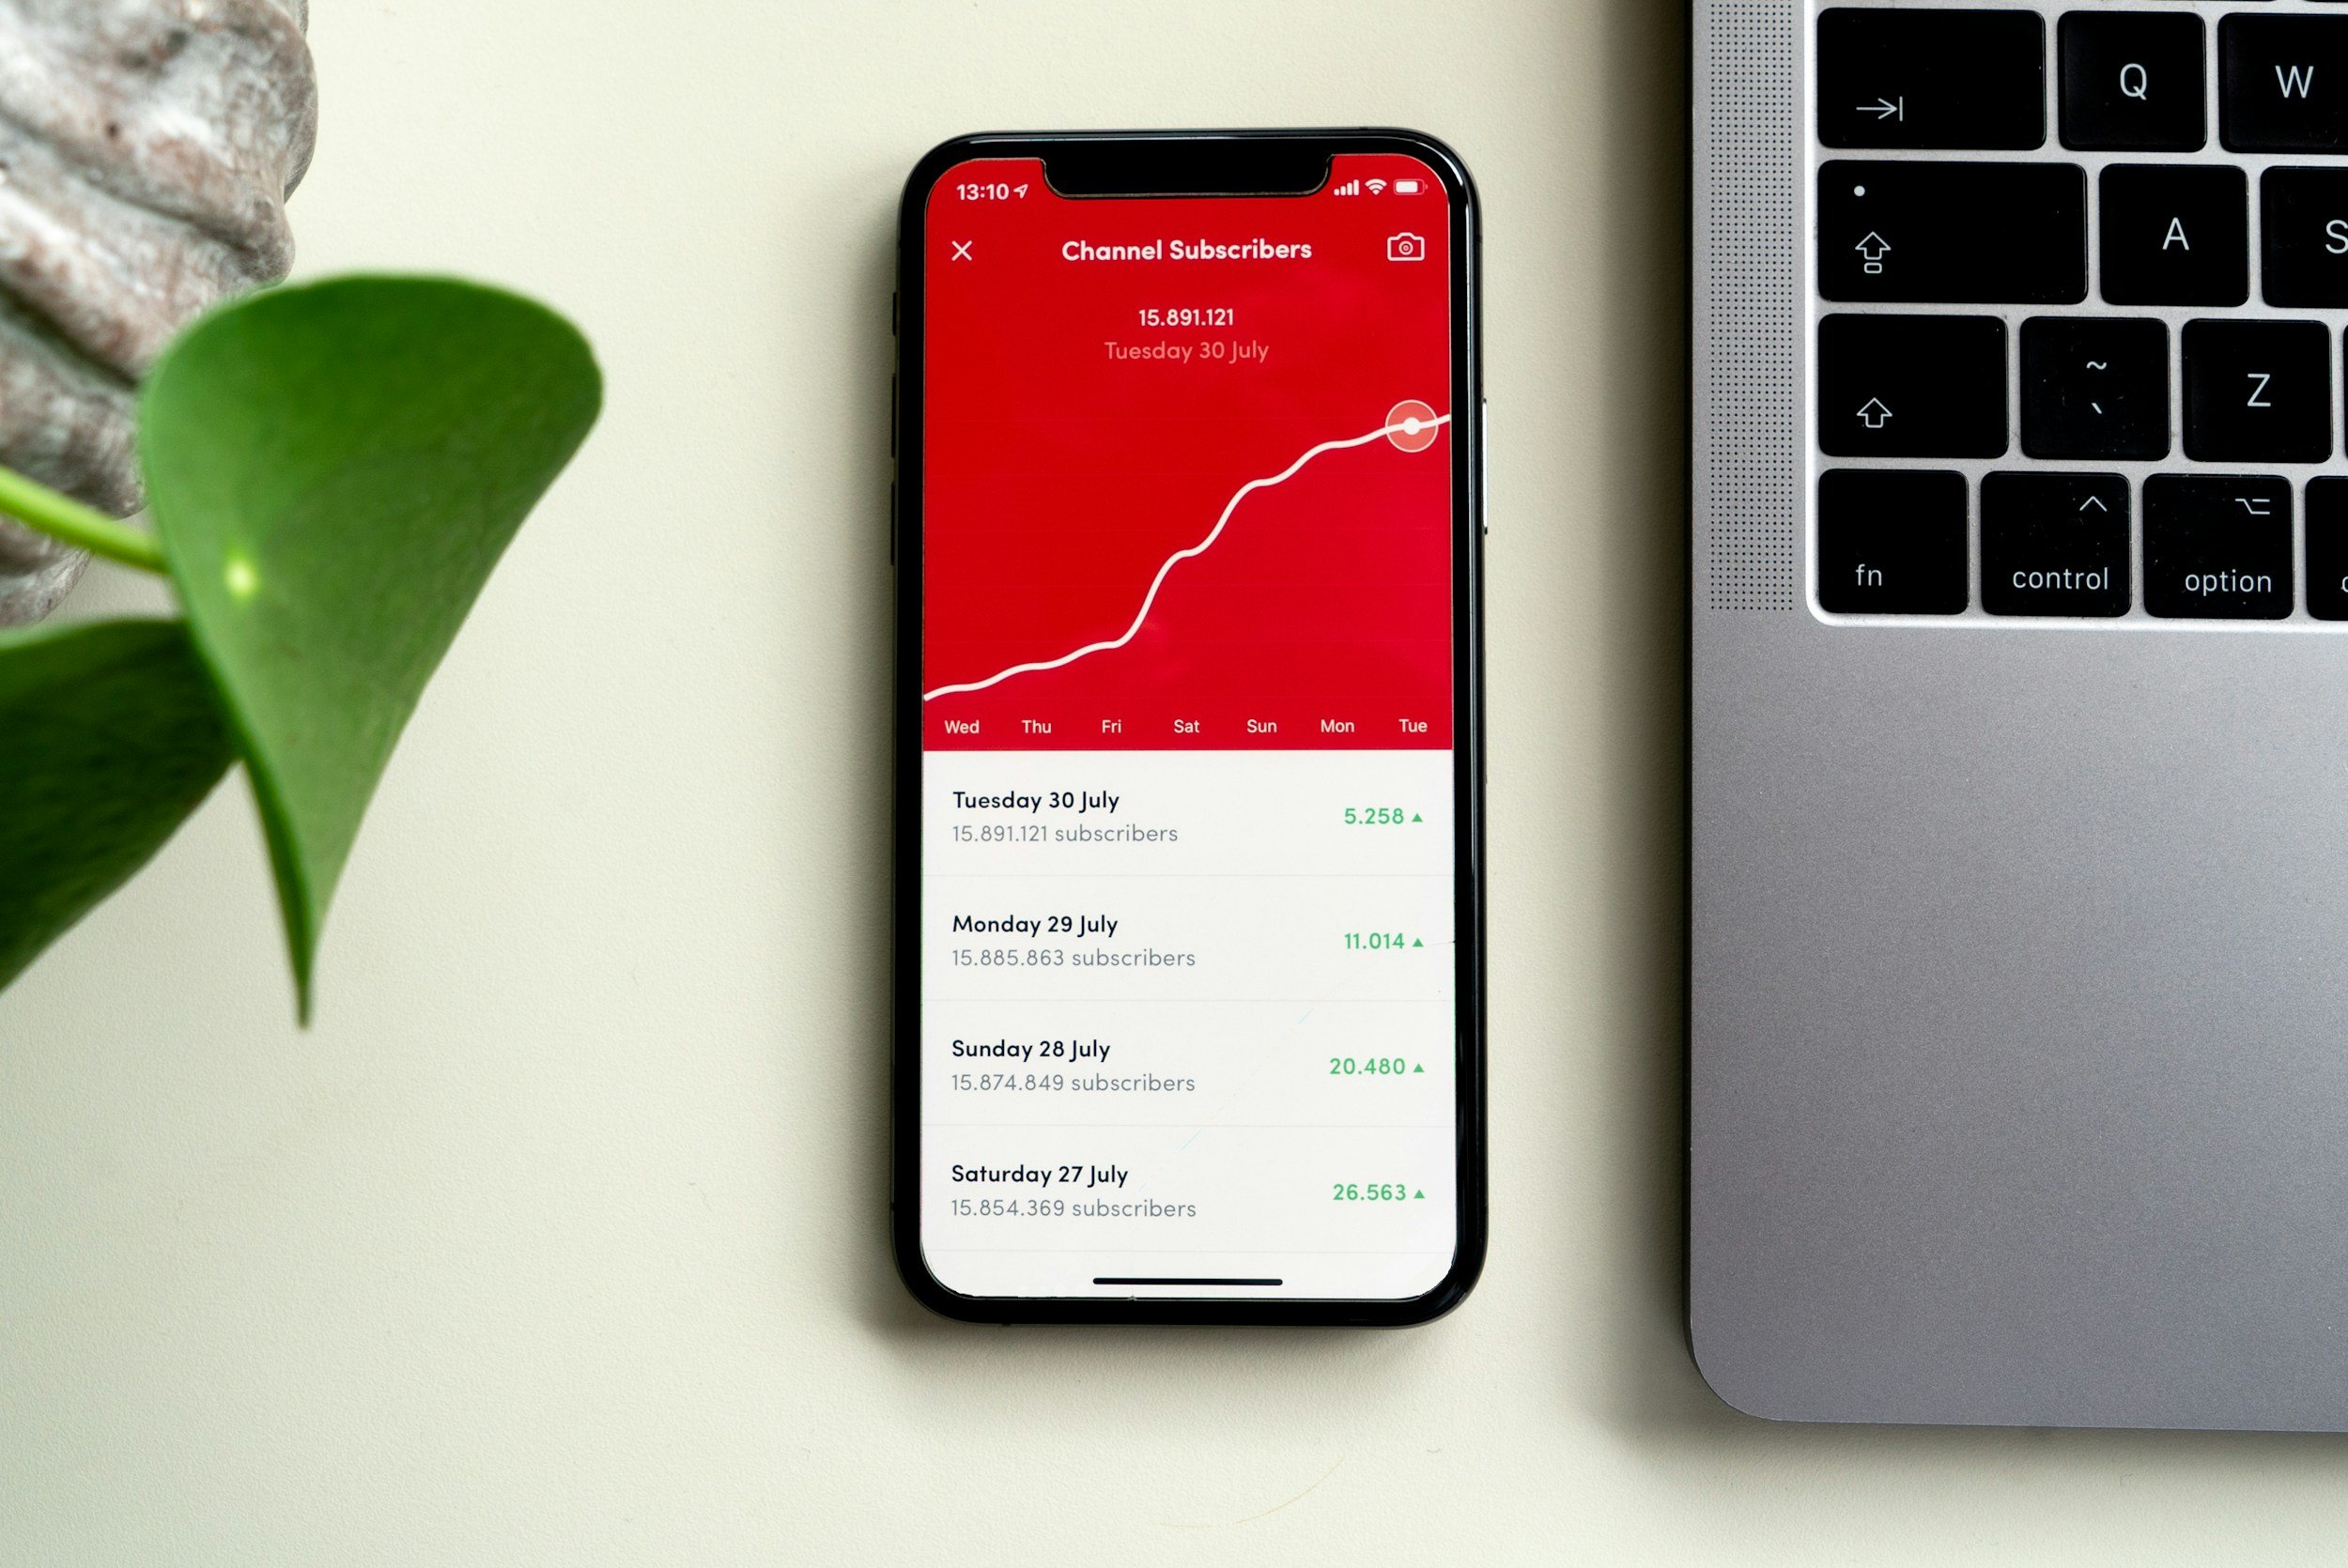
Table of Contents
How Does YouTube Decide What Content to Surface?
Before digging into specific YouTube video metrics, it’s helpful to know how the YouTube algorithm shows specific videos to users.
YouTube makes revenue based on views, so it makes sense that videos that users enjoy and watch longer and more often. The algorithm isn’t counting specific subscriber numbers, but rather whether people click on a video and whether or not they continue watching.
These three signals carry the most weight in the algorithm:
Watch Time and Retention: How long do people stay on a particular video? How long do they stay watching before clicking on to the next?
Click-Through Rate and Impressions: Are people clicking on your video’s thumbnail or title when they see it displayed? How often is it seen by unique users?
Engagement Signals (Likes, Comments, Shares): How are people responding to your video? Do they interact with the content positively and share it with others?
In essence, any metric that helps keep viewers engaged and encourages others to watch the video is the one creators and channel brands should focus on. Let’s dig into each a bit more:
Watch Time and Average View Duration
The more minutes users spend watching your video, the higher value YouTube will place on it. Higher watch times tell the YouTube algorithm that your video is worth recommending to other users on the platform.
A 2025 benchmark report analyzing over 150 million minutes of YouTube content found that the average retention rate sits around 23.7%. Nearly 55% of viewers will drop off within the first minute of a video – no matter the length! That means a video’s opening is critical.
Here are key retention benchmarks by video length:
| Video Length | Good Retention | Excellent Retention |
|---|---|---|
| Under 1 minute | 70%+ | 85%+ |
| 1–3 minutes | 60%+ | 75%+ |
| 3–5 minutes | 50%+ | 65%+ |
| 5–10 minutes | 45%+ | 60%+ |
| 10–20 minutes | 40%+ | 55%+ |
Here’s a statistic that may surprise most creators: only 1 in 6 videos breaks that 50% average retention rate. If you’re seeing 30% retention, it may be time to look at the video’s structure.
Are the intros too slow? Are sponsor reads too long and misplaced? Does the content not match what users expect to see?

Audience Retention and Key Moments
In the YouTube Analytics page, there’s a graph that shows a video’s audience retention rate. This shows the exact moment the average viewer stops watching.
Red 11 Media uses this data with clients to identify specific patterns where video content can be optimized. Observing consistent drop-off points that repeat across different videos can point to structural issues or pacing problems – which can often be fixed quickly in future scripts.
Practically, a retention rate of 50-70% of viewers at the 30-second mark and 40-60% at the one-minute mark is a good goal to strive for. Seeing where viewers rewatch videos can also unveil sweet spots in content that viewers enjoy.
Impressions and Click-Through Rate (CTR)
Impressions are an important metric to keep an eye on. This data is how often and where YouTube chooses to showcase your video to users, such as on the home feed or in search results. CTR measures whether that placement led to a click.
If impressions are strong but CTR is low, then it shows that a video is getting chances but losing them at the thumbnail or title.
A CTR in the 2-5% range is common across most channels. 5-10% is generally considered strong, depending on the niche and volume.
But don’t take CTR as the most important metric. It should always be considered with the others on this list. If you notice that your CTR is underperforming, it might be helpful to test out a new thumbnail or title to see if the rate performs better.
Traffic Sources
Another key data set to look at is Traffic Sources. This shows where viewers are coming from – be it YouTube search, suggested videos after a video ends, external sites linked to your content, etc. Each source gives you an idea of how well a channel is performing.
In general, search-driven traffic tends to be more stable than topic-specific traffic. Suggested video traffic scales faster, but depends on the algorithm’s momentum.
Knowing which sources are driving your traffic can help you know where to invest in growth (such as SEO-optimized titles for search or stronger hooks for suggested)
New vs. Returning Viewers and Views Per Viewer
These metrics can be found in the Audience tab.
A channel with high new viewers but low returning viewers reveals audience loyalty – in this case, strong discovery but a weak relationship with the audience.
If both are high, then the content is being considered bingeable and is growing in brand affinity.
Subscribers Gained Per Video and Revenue Metrics
This is different from the total subscriber count (which is covered below). Subscribers gained per individual video is a different and more useful metric. It shows which topics and formats earn loyalty – and how the channel can be optimized in that direction.
Revenue metrics such as RPM (revenue per thousand views), CPM, and top-earning videos are metrics that connect watch time and audience quality directly to the potential income a video can generate.
Tools to Improve Your YouTube Performance
While understanding these metrics is essential, using the right tools can make optimizing your content much easier. Platforms like VidiQ are designed specifically to help creators grow by providing actionable insights.
VidIQ offers features such as keyword research, competitor analysis, and real-time analytics that help you understand what topics are trending and how your videos are performing. It also provides optimization suggestions for titles, descriptions, and tags, which can improve your click-through rate and overall discoverability.
Using data-driven tools to refine thumbnails, titles, and content strategy can directly impact key ranking signals like watch time, engagement, and CTR, making them a valuable addition to any creator’s workflow.
What YouTube Vanity Metrics Aren’t As Helpful?
There are several metrics that can seem important, but don’t give you as much practical insight into how to grow your channel or brand.
An analysis of YouTube creator economics found that rapid subscription growth (often driven by Shorts) doesn’t reliably translate to long-term growth and income. Even YouTube has acknowledged that subscriptions are one of many feedback signals that impact content success.
Here are a few more vanity metrics that are worth looking at, but not building your strategy around:
| Metric | Why It's Overvalued | Better Metric to Watch |
|---|---|---|
|
Vanity Total Subscribers |
Distorted by Shorts; weak revenue signal and doesn't reflect genuine audience loyalty. |
Use Instead Average views per video, watch time |
|
Vanity Lifetime View Count |
Often inflated by viral spikes — not a reliable long-term growth signal. |
Use Instead Recent average views, watch time per video |
|
Vanity Like/Comment Counts Alone |
Easy to game and doesn't measure depth of viewer engagement or intent. |
Use Instead CTR + audience retention together |
Focus On The Metrics that Matter
YouTube gives account owners plenty of metrics to sift through, but optimizing for the right ones makes all the difference. Pick three to five metrics from this list and commit to a consistent weekly review.
As you begin to notice patterns emerge, take these as signals on where to optimize content. As always, knowing your numbers matters less than acting on the right ones regularly.
-
Key YouTube metrics for channel growth include watch time, average view duration, audience retention, click-through rate (CTR), and traffic sources.
-
Higher watch time signals to YouTube that your content is engaging, leading to better recommendations and increased visibility on the platform.
-
Audience retention indicates where viewers lose interest in your content, helping you refine your videos to keep them engaged longer.
-
Click-through rate measures how often users click on your video’s title or thumbnail, which is essential for attracting viewers to your content.
-
While subscriber count can provide social proof, it doesn't accurately reflect a channel's health or engagement, making it a less reliable metric for growth.

Red 11 Media is an educational platform and creative studio focused on driving growth online through strategic content creation. We help creators, brands, and businesses understand how to build sustainable audiences across YouTube, podcasting, and long-form digital content.